Sections of this topic

Gantt charts are a popular and time-tested way of visualizing project workflows. But they’re not just for any project. This project visualization approach aligns with the waterfall methodology that focuses on completing a task or process before the next one can begin.
A Gantt chart lets you organize a project’s timescale and create an overview of team members, resources, and essential ideas in one place. While it’s a powerful method used by veteran project managers, you can easily overcomplicate things if you’re new to it.
How Does a Gantt Chart Work?
Gantt charts as we know them today were created by engineer Henry L. Gantt in the 19th century. It’s a horizontal bar chart with project tasks on the vertical axis and a timeline on the horizontal axis. The chart depicts summary elements, milestones, and task dependencies all in one place.
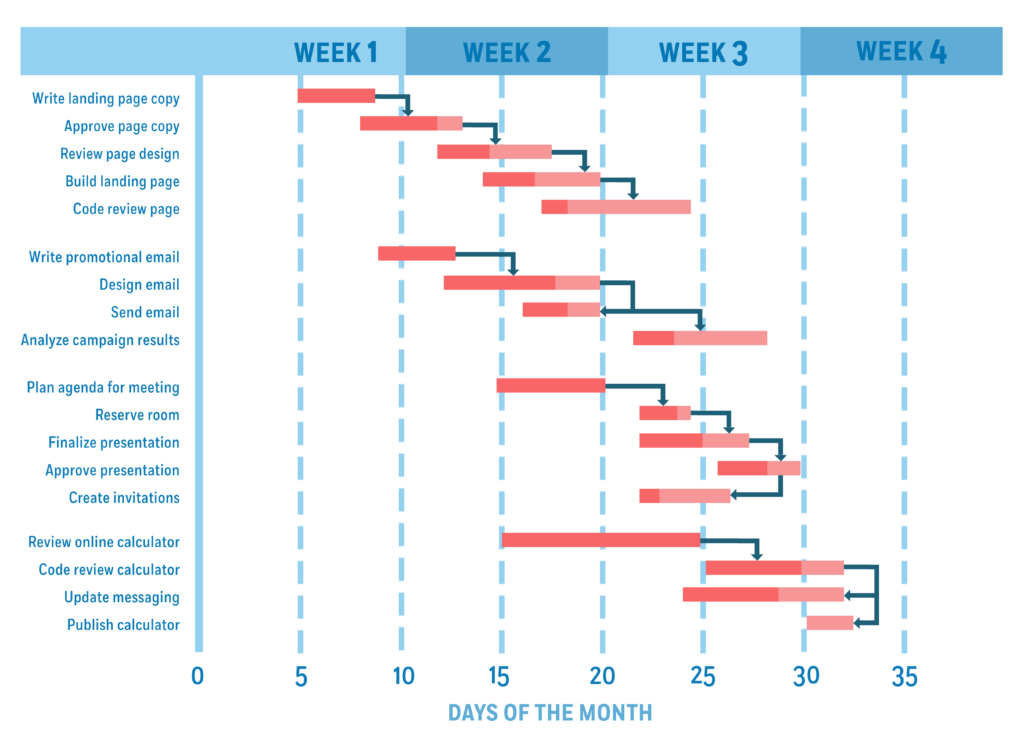
If it’s the first time you’ve come across Gantt charts, they can look like a stack of bars and arrows. Before moving forward, you need to understand the structure of a Gantt chart and what each bar, its length, and arrow represents.
A Gantt chart is made up of three elements: tasks, task durations, and task dependencies.
- Tasks: Each horizontal bar on a Gantt chart represents an individual task in the project. These are the basic building blocks of a project.
- Task duration: The length of each bar represents the duration of each project. The starting point of each bar, in relation to the x-axis at the bottom of the chart, represents when each task will start.
- Task dependencies: The arrows leading from one bar to the next represent a task dependency. It means the task at the tail of the arrow must be completed first for the task at the head to start.
Key Concepts of a Gantt Chart
The explanation of the three features above is enough for you to have a clear understanding of what a Gantt chart represents. But to have a better understanding of how Gantt charts work, you need to understand a few underlying concepts: the critical path, milestones, dependencies, and resource management.
The Critical Path
The critical path provides an overarching order to your project, establishing a baseline for you to follow. Arguably, the critical path is the most important part of a Gantt chart’s layout. It represents the journey of the project from start to finish.
Every essential aspect of the project is represented in the critical path, which is usually highlighted, for example in red, to symbolize its importance in the project. Any delays in the critical path tasks will lead to inevitable delays in the project.
Milestones
Typically represented as a symbol or shape interposed at certain intervals in the project, a milestone depicts the key goals in the project. Unlike tasks, they are set points in time that give you an idea of what things you need to have completed at what time. Not only do milestones emphasize both minor and major goals within the project, but they also help to create depth in the timescale, breaking it down into manageable pieces.
Dependencies
Dependencies show progression in the chart. These tasks tend to be represented with arrows between one another, highlighting the necessary progression of tasks to reach a goal. This is particularly effective both for providing an overview of a project and so that team members can understand how their particular task fits into place.
The benefits of dependencies include improving collaboration and productivity because when everyone understands their job and their responsibility within the group, they can work towards achieving the collective goal.
Resource Management
One of the greatest benefits of using a Gantt chart is the ability to accurately map out the resources you need, whether that be people or products. You can easily assign tasks to team members according to their strengths. This way, you maximize your team’s efficiency.
Similarly, material resources can be simply distributed using the timescale. This makes ordering and coordinating resources a process that can be managed according to the details on the chart. No more dithering with forms and running out of essential supplies, keeping track of what is needed becomes simple on a Gantt.
Now that you have a better understanding of what Gantt charts are and their underlying principles, let’s move on to the interesting part.
Obviously, you need to learn how to create one before you can learn how to use a Gantt chart. This is why we’ve divided this guide into two parts: creating a Gantt chart and using one. That said, the entire Gantt project management process is pretty simple. The goal is to not overcomplicate things. Follow this principle and you should have a pretty well-planned project schedule on your hands.
How to Create a Gantt Chart in 4 Steps
Creating and using a Gantt chart can be slightly different with different project management tools. We’ll use a generic approach to make this guide easy to understand and follow no matter which project management tools you use.
Step 1: Define Project Outcome and Time Range
Gantt charts are based on the waterfall model which emphasizes clearly defining your project outcome and time frames up-front. You should have a clear understanding of what you or your client wants at the end of the project. This way, it’s easier for you to define the critical path and all the associated individual tasks you need to complete to get there.
You also need to define the time range so your Gantt chart project has a clear start and end date. This timeline will form the foundation on which you build your project Gantt chart.
Step 2: Identify all Essential Project Tasks
The next step is to break down your entire project into smaller, more manageable bits. This is a two-fold process where you first divide your project into subprojects and then identify individual tasks in each of those projects. But this is for larger, more complex projects. If you’ve got a smaller project, you can jump to identifying individual tasks and arrange them chronologically.
Step 3: Identify Relationships between Tasks
This is where you use arrows between tasks and set dependencies. You need to identify the relationships between tasks and decide which task is dependent on which and in what way. Setting dependencies is as easy as drawing an arrow between two bars.
Simply put, there are two types of relationships between tasks: successor and predecessor. But you have four types of dependencies you can set between tasks.
- Finish to Start – Can’t start the successor task until the predecessor finishes.
- Start to Start – Can’t start the successor task until the predecessor starts.
- Start to Finish – Can’t finish the successor activity until the predecessor starts.
- Finish to Finish – Can’t finish the successor activity until the predecessor finishes.
Step 4: Add Dates, Resources, and Milestones
Once you’ve identified tasks and identified the relationships between them, your Gantt chart is almost ready to go. All you need to do is add some dates, assign tasks to team members, and set important milestones and you’ll have a ready-to-go Gantt chart.
Finalize when a task starts and when it should be completed. This will help you identify tentative deadlines for your sub-projects and add milestones to the critical path. If your project is already underway, you can start assigning tasks to team members. This completes the creation of the Gantt chart.
If you’re using suitable project management software, creating a Gantt chart would be easy. But if you’re going with conventional spreadsheets, you will have to create and format a chart manually. Once your chart is created, remember to update it as things change. It’s important to review your chart at least once a week to reflect on progress and other changes to your project.
How to Use a Gantt Chart to Plan a Project
Once you’ve created the chart, it’s now time to use it to manage your project. But before we begin, let’s check out a stat that emphasizes the importance of using Gantt charts for project planning.
Approximately 39% of projects fail due to a lack of planning. This is where Gantt management comes in. Project managers can map out the complete project, determine deadlines, and manage your team and resources effectively using Gantt charts. Here are the rest of the steps you need to follow to use a Gantt chart to plan a project.
Step 5: Conduct Workflow Analysis
Gantt charts let you conduct your project’s workflow analysis with ease. This means you can view not only the timescale of work to be performed but chart who is doing that work and what resources you need to put towards certain tasks.
Workflow analysis is a great tool for managers who wish to see, both at a glance and in greater depth how a project is progressing and how resources are being allocated. This makes coordinating teams easier and provides information on progression for each individual as well as on the team.
Using project management software often allows you to utilize additional features which can build upon your workflow analysis within a Gantt chart. Due to the graphic nature of the chart, using it for statistical modeling and further graphing is a beneficial way of understanding project and team workflow.
Step 6: Identify Critical Path
By identifying the critical path in a project, it also becomes simpler to identify priorities and areas of focus for teams and individuals. Because all team members can view this information, everyone has the same level of awareness of the tasks at hand, their deadlines, and the milestones the team is aiming for.
Allowing total transparency in accessing the Gantt chart has many benefits, but access to the critical path is a paramount example. Collaboration and work towards milestones are both improved by improving awareness of the tasks at hand. When a whole team is aiming toward the same goals, there is a greater sense of cohesiveness.
Step 7: Make Your Project More Manageable
Another benefit of the graphical representation of projects through a Gantt chart is that it breaks projects down into more manageable chunks. Through both critical paths and dependencies, it is clear which bar represents which task and the chain of work that is required to progress a project.
As a result of this, each project becomes a set of smaller tasks that can be delegated and sourced out to team members, so everyone has a manageable role within the process, and nobody needs to feel overwhelmed by taking on the project as a whole. The simplistic formatting of the Gantt also allows for fewer meetings and briefings, saving time.
Step 8: Meet Deadlines
The Gantt chart also presents a methodical and automated depiction of a project, so deadlines become more accurate and reliable. Due to dependencies and the following of a critical path, everything runs smoothly according to a plan. Should work get delayed, it is easily amended on the chart.
Deadlines are both easier to follow and easier to correct on a modern Gantt chart. Because the progress of each task is visible, and optionally the progress of individual team members too, keeping on schedule is the priority of everyone as an individual and as a collective. Seeing which tasks to prioritize also enables resources to be better allocated in line with goals.
Step 9: Monitor Project Progress
The final step in managing your project with a Gantt chart involves keeping a close eye on both the Gantt chart as well as those carrying out the project, adjusting the plans as the work progresses.
Maybe a piece of equipment will break down that will set back the start date. Or perhaps the team will take on another project that takes precedence. There could be changes in funding. Or maybe the client will change their mind?
Change is inevitable, but luckily, modern-day Gantt charts don’t require that you start from scratch. By using some elements of the agile methodology, you can make the adjustments as necessary and keep your team up to date.
To monitor project progress, all you need to do is to check the completion level of each bar or team member. This is especially helpful for project managers, especially in industries like marketing, where different strands of a project come together, such as creative tasks and writing tasks.
Top 3 Gantt Chart Software for Project Management
The era of paper and pencil Gantt charts is long gone. So is the time of creating Gantt charts on spreadsheets. Today’s fast-paced work environment demands creativity and swiftness in project management methodologies which is made possible by project management software.
Creating and using Gantt charts becomes much easier when you use Gantt project management software, also known as Gantt chart software. Here are our top picks for the best project management software for Gantt management.
TeamGantt
Launched in 2010, TeamGantt, a PM tool with time tracking feature, is a Gantt chart creator that makes it simple for you to schedule, manage, and track project tasks and resources. It helps you organize all your documents, conversations, and tasks in one central hub.
It has a powerful drag-and-drop feature that lets you start planning your projects in minutes. TeamGantt is one of the simplest project management software as it is fairly easy to use with customizable Gantt chart templates. It also offers a free plan for small, three-member teams.
- Built-in Gantt view
- Risk assessment templates
- Built-in time tracking ability
- Limited features
- No integrations.
- Lacking customer support
Pricing
- Free: Free for 3 users
- Standard plan: $24.95 per month for 1 user + unlimited guests
- Advanced plan: $29.95 per month for 1 user + unlimited guests
GanttPRO
GanttPRO offers affordable pricing plans and an intuitive interface along with advanced features, making it a great choice for SMBs. With GanttPRO, you’ll be able to plan your project timelines and oversee individual tasks, resources, and your team efficiently.
Features like importing and exporting options, history and baseline mode, and custom and pre-configured templates make it an attractive choice for Gantt management. GanttPRO also offers integrations with common software like Jira Cloud, Slack, and Google Drive.
- Intuitive and easy-to-use interface
- Affordable and simple pricing structure
- History and baseline mode let you save and return to previous project versions
- Limited reporting options
- Basic integrations only
- Limited customer support
Pricing
- Individual: $15 per user month (billed annually)
- Team: $8.90 per user month (billed annually)
monday.com
monday.com offers a range of simple but powerful features for small, remote teams. With its easy-to-use interface, this tool makes it simple to design project workflows and handle day-to-day project tasks.
monday.com offers Gantt chart views in all of its plans and customizable workflow templates for different kinds of projects. It offers integrations with a range of other apps so you can streamline your management with ease. Read the full monday.com review for greater insight into it.
- Modern user interface (UI) is easy to use and navigate
- Highly customizable features
- Ideal for managing ongoing work for multiple projects
- Confusing pricing of plans
- Slow customer support
- Best features only available with upper tiers of paid plans
Pricing
- Basic: $10/user per month
- Standard: $12/user per month
- Pro: $20/user per month
- Enterprise: Inquire for price
Frequently Asked Questions (FAQs) for How to Use a Gantt Chart
Here are some frequently asked questions about how to use a Gantt chart to plan a project.
Bottom Line – How to Use a Gantt Chart
Gantt charts are a powerful project management tool that lets you map out your project efficiently and have a clear overview of project progression. Creating and using Gantt charts to plan a project is pretty simple and doesn’t involve a lot of technical skills.
Remember that you want to keep things as simple as possible. It’s easy to overcomplicate things with Gantt charts and this is where it starts going downhill. A quality project management software, also known as Gantt chart software, like TeamGantt, GanttPRO, or monday.com can help you use Gantt charts with ease.